Picture It Settled®
Picture It Settled® Patent-Pending Technology:
- Helps parties evaluate cases with probabilistic scenarios.
- Draws on historically successful negotiating rounds to help users plot successful negotiation moves targeting their evaluations.
- Uses the Settlement Prophet™ application to project when the parties are likely to settle and the amount of the settlement.
How It Works
Picture It Settled® predictions help parties and their lawyers improve their results by modeling anticipated reactions certain behavior will elicit from their opponent – just as weather forecasters model storms using some of the largest computers available to project the path of a hurricane. Artificial intelligence is no substitute for well-honed human expertise, but it does help improve forecasts by quickly modeling dozens of scenarios. Similarly, Picture It Settled® doesn’t replace honed intuition; it guides decision-makers by quickly modeling anticipated reactions based on thousands of cases.
Using Picture It Settled® when offers start rolling in from the opponent, the negotiator can see if and when a settlement might be reached, fine-tune objectives, and plan future concessions accordingly.
Scenario Planning
To effectively negotiate a litigated case, Picture It Settled® guides professionals through a realistic assessment of likely outcomes, asking them to estimate best and worst scenarios. The best case scenario for a plaintiff might be $4M, while the worst case scenario might be a take-nothing-judgment and potentially an attorney fee award to the other side. Other potential outcomes might fall between these extremes: perhaps $2M and $1M outcomes.
Determining what outcome may result from one trial is difficult, but estimating the probability of a range of outcome scenarios resulting from multiple trials adds perspective. If plaintiffs are asked how many times out of 100 they expect the high outcome, their assessment will naturally skew toward higher numbers – they expect to get more money. Asked to play the other side, they may be slightly less optimistic, but their numbers will still lean at least 15% toward the number they prefer. The opposite is true of defendants. Picture It Settled® helps litigants debias their initial assessments to develop a pragmatic negotiation plan.
Negotiation Move Planning
Based on an assessment of the potential outcomes, a user can narrow the target settlement range, and then focus on timing concessions. The negotiation dance can only be rushed so much – the right number at the wrong time is the wrong number. Picture It Settled® allows you to optimize a concession plan based on thousands of successful negotiations, excluding those ending in impasse.
Say you are the plaintiff and, based on your scenario case evaluation, you want to end up at $1.8 million. Picture It Settled® helps you decide what your initial offer should be by examining similar cases. Based on that data, Picture It Settled® suggests a series of offers that help you reach your goal. You may determine that you’d better start at $4 million to land at $1.8 million. Enter $1.8 million as your Target Settlement, expected around 4:30pm, and $4 million, offered at about 10:30am, as the Plaintiff’s Initial Offer. Based on those inputs, Picture It Settled then calculates a negotiation plan that spreads concessions out over time to optimize signaling to the other side and increase the odds of success.
You can customize the plan based on your knowledge of the case and your negotiating counterpart by adjusting the number of rounds, offer timing, and dollar increment at the beginning or end of the plan. You can also easily model what you expect the other side to do.
Offer Projections Using Settlement Prophet®
Real-time forecasts sharpen the negotiator’s aim and improve results. Wouldn’t you like to know where your next round is headed? Wonder whether you’re moving toward a settlement or wasting time? Get real-time projections in time and money based on deep data and the internal dynamics of a particular round?
The Picture It Settled® Settlement Prophet™ does just that. See graph at right. The most likely scenarios appear in darker colors and less likely moves appear in lighter shades. The intersection point of the darkest colors in time and money estimates the most likely settlement.
While projections will begin with two moves on each side, accuracy of the prediction increases as more data is added. The system is not static and continually learns from new data. The predictions telegraph success or failure and allow for fact-based, mid-course corrections based on valuation data coming in the form of bid and ask prices from the other side. Whether this round will succeed now has an answer.
Security
Picture It Settled® was built with security features by a well-known applied research organization and is layered with Gazzang for security levels equal to those used to protect health and financial records.
Data
The Picture It Settled® database contains thousands of cases contributed by lawyers, companies, mediators, and other sources. So that we could test early conclusions from this control set of data, we introduced smartphone apps (Android and Apple in 2011; BlackBerry in 2012) that allowed users to draw settlement infographics with an algorithm. In doing so, they augmented the control data set with several thousand more anonymous cases.
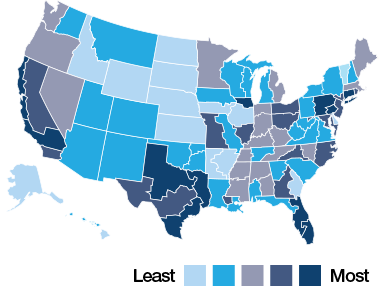
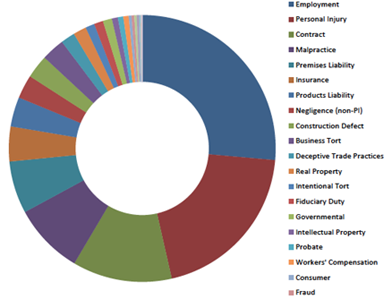
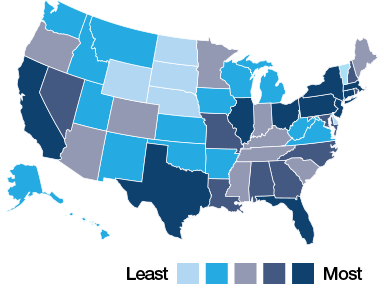
The resulting database looks like U.S. case filings. Employment and personal injury cases represent the largest concentrations, but intellectual property and construction claims are well represented. Since litigation is localized, the cases cover most jurisdictions but expectedly concentrate in the major litigation centers.
Cases
6,000+ control data
14,000+ mobile apps
Rounds
3 Lowest
6.28 Average
54 Highest
Venue
State
Federal District